Sunday, April 24, 2011

Range Graded Proportional Circle Map

http://mapmaker.rutgers.edu/355/links.html
A range graded proportional circle map has multiple groups and each circle can represent a specific amount in the data. This particular range graded proportional circle map of Michigan is showing population numbers in Urbanized areas, outside urbanized areas, and rural population. 

Star Plots


A star plots portray multiple variables on star looking chart. Each point is a different variable.

Similarity Matrix

http://cgi.mtc.sri.com/Cluster-Lab/
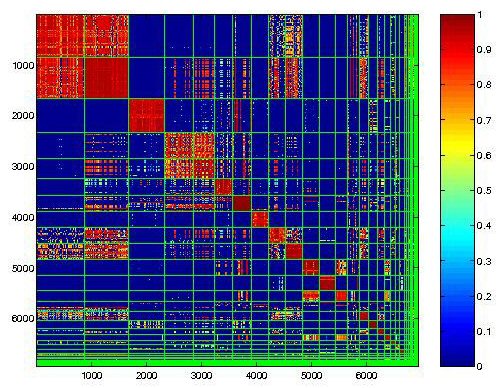
A similarity matrix is a table that shows similar data variables, usually in a diagonal direction on the table.  Each square and its color determines that amount of similarity between each variable. This is an example of a behavioral clustering similarity matrix. 

Stem and Leaf Plot

http://www.eduplace.com/math/mhm/5/06a/index.html

A steam and leaf plot represents data in a graphical form with the use of numbers. The graph or chart assists in visualizing the data. 

Histogram

http://www.aivosto.com/project/help/pm-charts.html


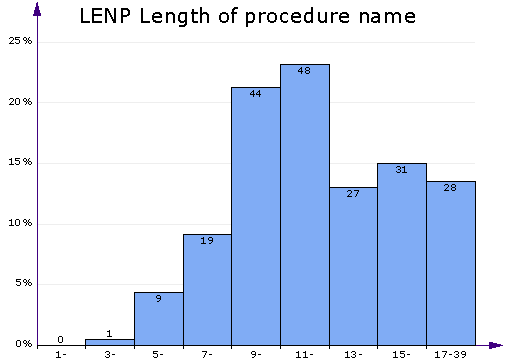
A histogram is a graphical representation, consisting of tabular frequencies, that shows distribution of data.  Each tabular frequency is shown as adjacent rectangles, usually varying in size because of different data.  The higher the bar means higher number. 

Box Plot


A box plot is a simple way of graphically depicting numerical data.  It is done through five-number summaries: sample min, Q1, Q2, Q3, and sample max.

Parallel Coordinate Graph

A parallel coordinate graph shows multiple sets of data or information, which is plotted on the vertical axis. Each line represents a different set of data and is a different color.  Parallel coordinate graphs are good for comparing larger amounts of data in one graph.