
Sunday, April 24, 2011
Cave Paintings

Nominal Area Choropleth Maps

Nominal area choropleth maps display nominal data or information about a specific subject. Nominal area choropleth maps usually have at least two categories. This is a nominal area choropleth map showing each states political status.
Standardized Choropleth Maps

http://www.statcan.gc.ca/pub/92f0138m/2008003/figures/5200001-eng.htm
Standardized choropleth maps use different colors and shadings to compare areas and the data on the map. This standardized choropleth map shows the percentage of population aged 14 years and under living in different areas of Canada.
Correlation Matrix

http://www.image.ucar.edu/GSP/Projects/ResearchNuggets.shtml
A correlation matrix is a table comparing two items and the correlation between the things on the table. This image is showing 4 different correlation matrix tables and shows the correlations between each.
Unclassed Choropleth Maps

An unclassed choropleth map uses different degrees of darknesses for areas in order to differentiate them according to their numeric value. This unclassed choropleth map of France shows the distribution and intensity of illiteracy in 1826.
Classed Choropleth Maps

A classed choropleth map is a basic type of thematic map that is used to display data or information among different areas. A classed choropleth map usually shows an area of smaller proportion. This map shows the percent of blacks in the Chicago, IL community areas during 1990.
Continuously Variable Proportional Circle Map

http://connect.in.com/circle-line-map/photos-1-1-1-72426a2f1fd578228f1718a4c1204c2d.html
A type of proportion circle map which goes into more detail in order to create additional points of specific data is known as a continuously variable proportional circle map. A continuously variable proportional circle maps has circles which are in proportion of the data being measured.
Range Graded Proportional Circle Map

http://mapmaker.rutgers.edu/355/links.html
A range graded proportional circle map has multiple groups and each circle can represent a specific amount in the data. This particular range graded proportional circle map of Michigan is showing population numbers in Urbanized areas, outside urbanized areas, and rural population.
Star Plots

A star plots portray multiple variables on star looking chart. Each point is a different variable.
Similarity Matrix
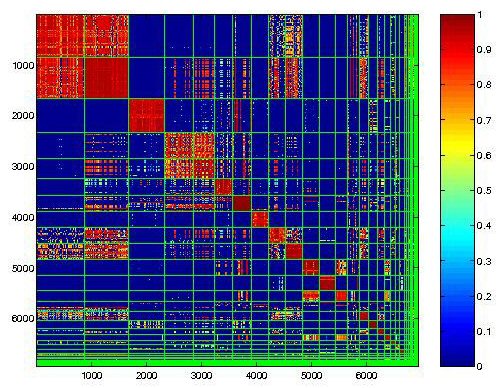
http://cgi.mtc.sri.com/Cluster-Lab/
A similarity matrix is a table that shows similar data variables, usually in a diagonal direction on the table. Each square and its color determines that amount of similarity between each variable. This is an example of a behavioral clustering similarity matrix.
Stem and Leaf Plot

http://www.eduplace.com/math/mhm/5/06a/index.html
A steam and leaf plot represents data in a graphical form with the use of numbers. The graph or chart assists in visualizing the data.
Histogram
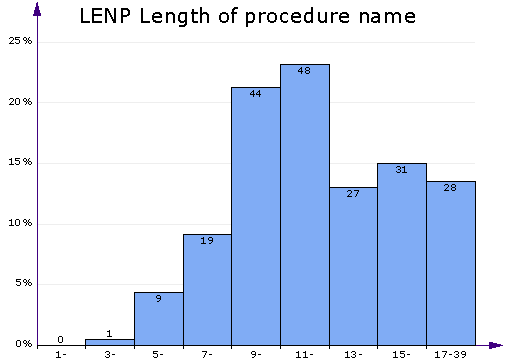
http://www.aivosto.com/project/help/pm-charts.html
A histogram is a graphical representation, consisting of tabular frequencies, that shows distribution of data. Each tabular frequency is shown as adjacent rectangles, usually varying in size because of different data. The higher the bar means higher number.
Box Plot

A box plot is a simple way of graphically depicting numerical data. It is done through five-number summaries: sample min, Q1, Q2, Q3, and sample max.
Parallel Coordinate Graph

A parallel coordinate graph shows multiple sets of data or information, which is plotted on the vertical axis. Each line represents a different set of data and is a different color. Parallel coordinate graphs are good for comparing larger amounts of data in one graph.
Triangular Plot

A triangular plot is a barycentric plot that consists of three variables which sum to a constant. The three different variables are positioned on an equilateral triangle.
Wind Rose


Meteorologists use a wind rose to determine how wind speed and direction are typically distributed at a particular area. Wind roses were predecessors of the compass rose, commonly found on maps.
Climograph

Climographs are graphical depictions of the monthly rainfall and temperature condition for a particular area. Temperature is recorded on the line graph and the amount of monthly precipitation is recorded on the bar graph.
Population Profile

A population profile is a bar chart that shows the age groups of people that live in that area. There are usually two separate graphs to differentiate the male and female numbers. This particular population profile is of Portugal in the year 2010.
Scatter Plot
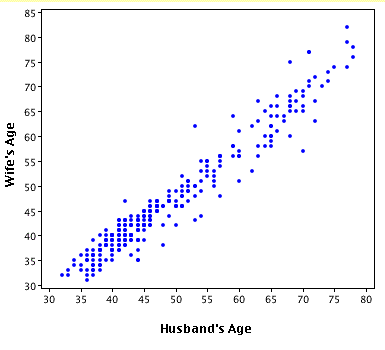
A scatter plot is a diagram that portrays values for two different variables, one on y axis and one on x axis. Scatter plots are great for showing trends that are occurring between each axis.
Index Value Plot

An index value plot is a visualization map that is plotted on a line graph. The values depicted are not an absolute value because the map is more concerned with the trend of the line. This particular index value plot shows significant decreases in index value during recessions.
Subscribe to:
Posts (Atom)